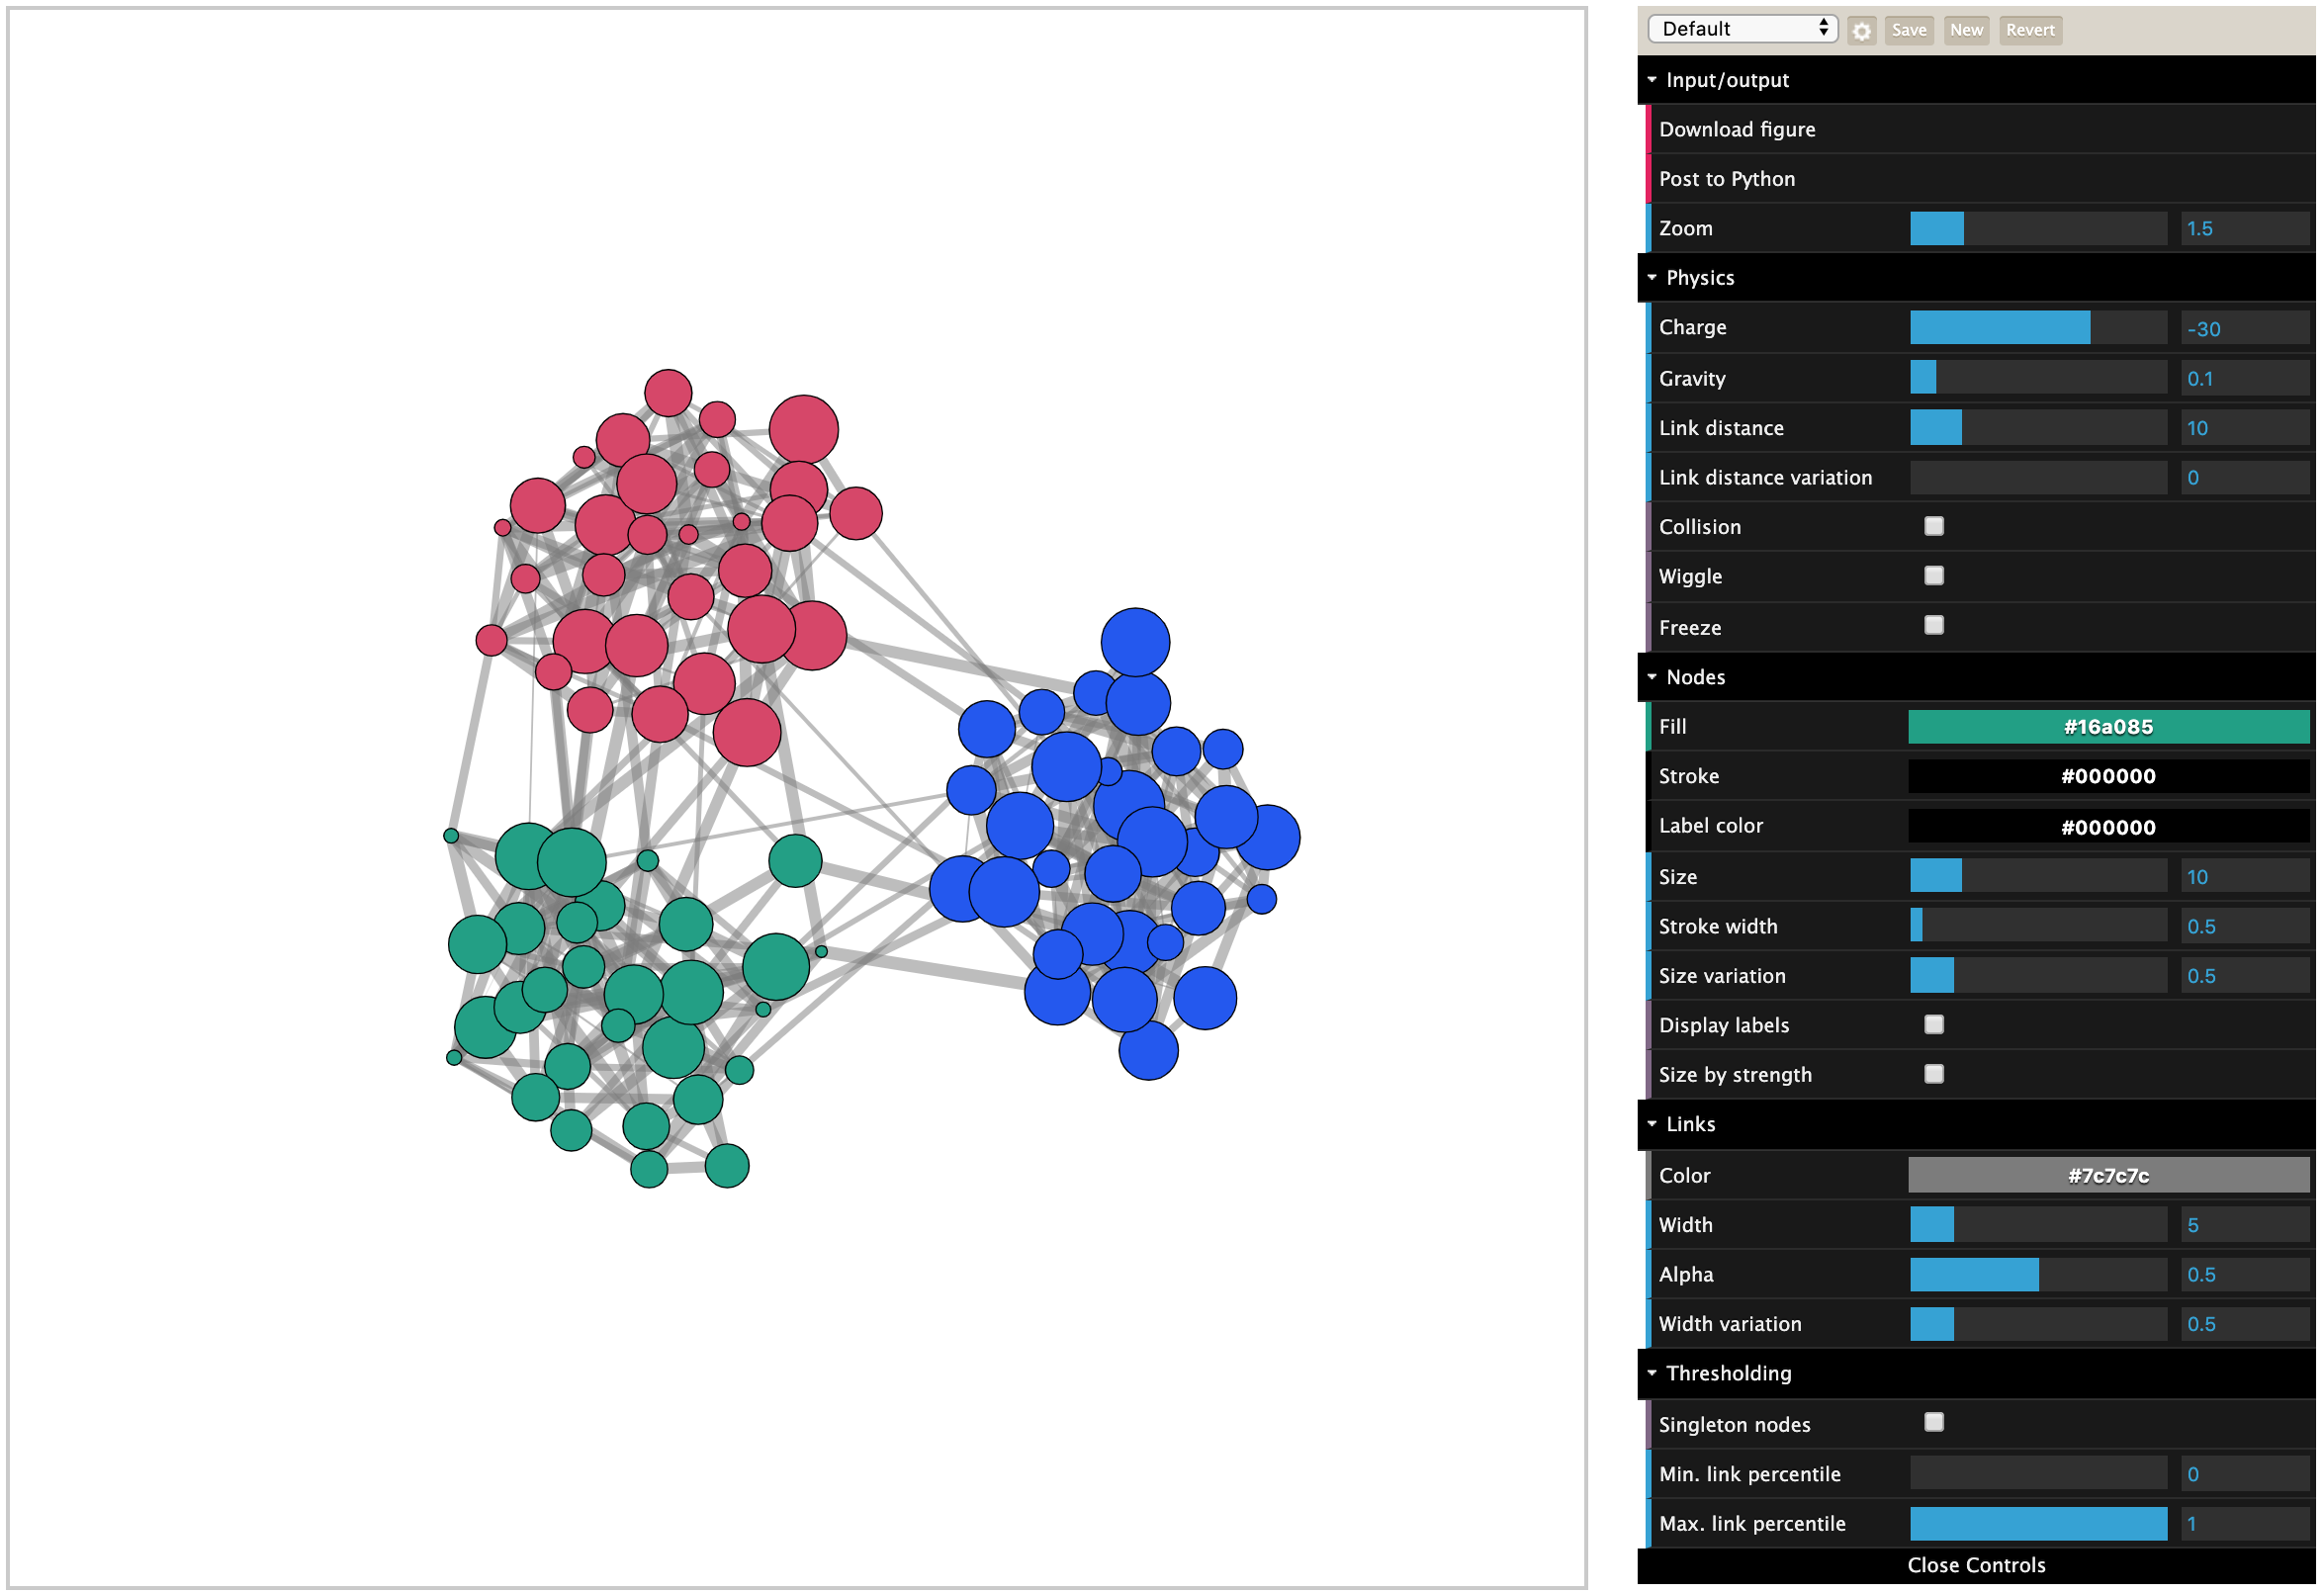
I was simply annoyed that network visualization in Python was such a horrible thing to do. And it felt even more frustrating, given the vast number of researchers out there doing research in networks using Python. After endless Googling phrases like "d3 network python" and "networkx visualize d3", I figured I would write a small webapp where I could upload a node-link graph in JSON format produced by networkx, and visualize the network using canvas and d3.
So I did just that.
Initially, I didn't actually make the thing work directly from the Python console, because it felt too cumbersome. But luckly there's awesome people out there that will pick up where you leave off and take things to the next level. Benjamin Maier whom I met when I visited Dirk Brockmann's lab wrote a Python API to my web app called 'Netwulf'. The name was his idea. AND IT ROCKS. Now I can simply take a networkx.Graph and launch it locally as an awesome interactive visualization like:
          from netwulf import visualize
          visulize(G)
          # new browser window opens
